Evaluation
Golden Dataset
What Is a Golden Dataset?
A golden dataset is a curated set of question-and-answer pairs that represents the queries your system should be able to answer correctly. It serves as the ground truth for evaluating retrieval quality — the benchmark against which Vedana’s responses are measured. You can use the golden dataset we prepared at: Grist
Or you can prepare a golden dataset of your own.
Each entry in the golden dataset contains a question as a user would ask it, and the expected correct answer. During evaluation, Vedana sends each question through the full retrieval pipeline and compares the result against the expected answer.
A well-constructed golden dataset should:
- Cover the main question types your users will ask
- Include both structured questions (specific values, dates, names) and open-ended questions (explanations, summaries, policies)
- Reflect real or realistic phrasing, not idealized input
- Include edge cases and questions that are likely to stress retrieval boundaries
The golden dataset is not a test of the language model’s general ability. It is a test of whether the graph is correctly structured, whether the right data was ingested, and whether the retrieval tools are selecting the right information.
How to Start a Test
1. Prepare the golden dataset
Create a table with two columns: question and expected_answer. Each row is one evaluation pair.
Example:
| question | expected_answer |
|---|---|
| Who likes Quokkas? | Geneva Durben |
| What are Geneva Durben’s interests? | Quokkas, Slide Rules, Mosaic, Eating Disorders, Tantric, Marrakesh |
| Which people are interested in Joshua Trees? | Flo Zaugg, Nathen Saadia |
Keep expected answers concise and factual. For structured questions the answer should match the exact value stored in the graph. For document-based questions the answer should capture the key information a correct response would contain.
2. Upload the golden dataset to Grist
Upload your golden dataset table to Grist during the initial setup step (see step 5 of the Quickstart). It should be added as its own table, separate from your domain data and data model.
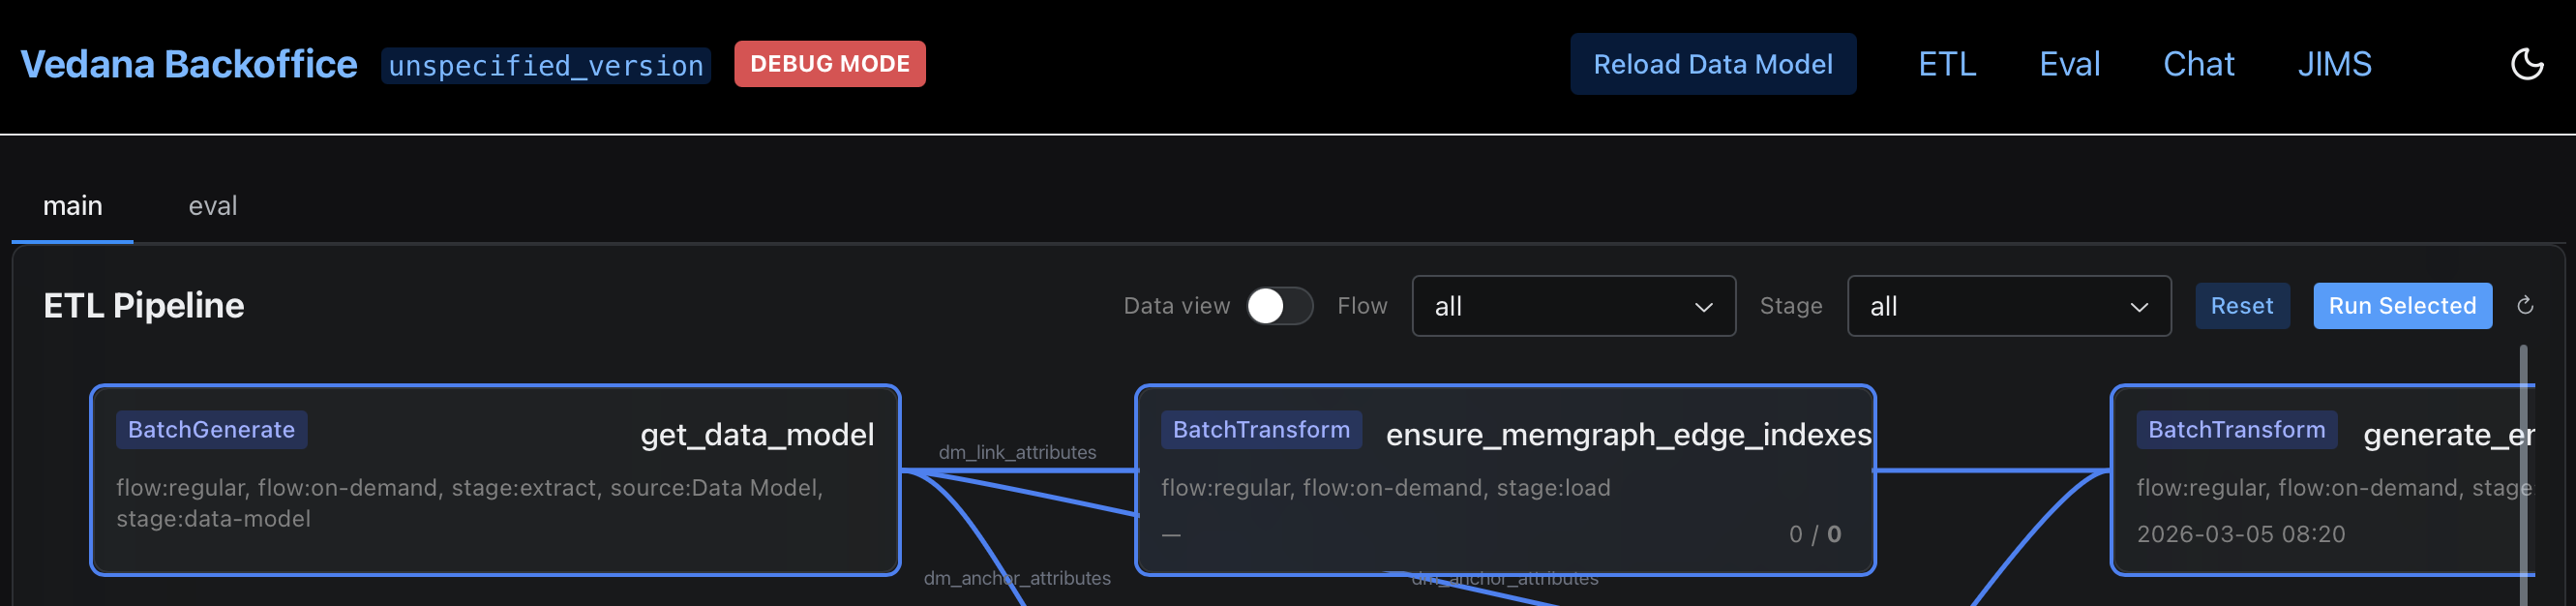
3. Run ETL
The golden dataset is loaded into the evaluation pipeline during ETL.
- Navigate to the ETL section > main tab, and run the pipeline by clicking ‘Run Selected’.
- Ensure ETL has completed successfully before running a test, including data model load, data load, and embedding generation.
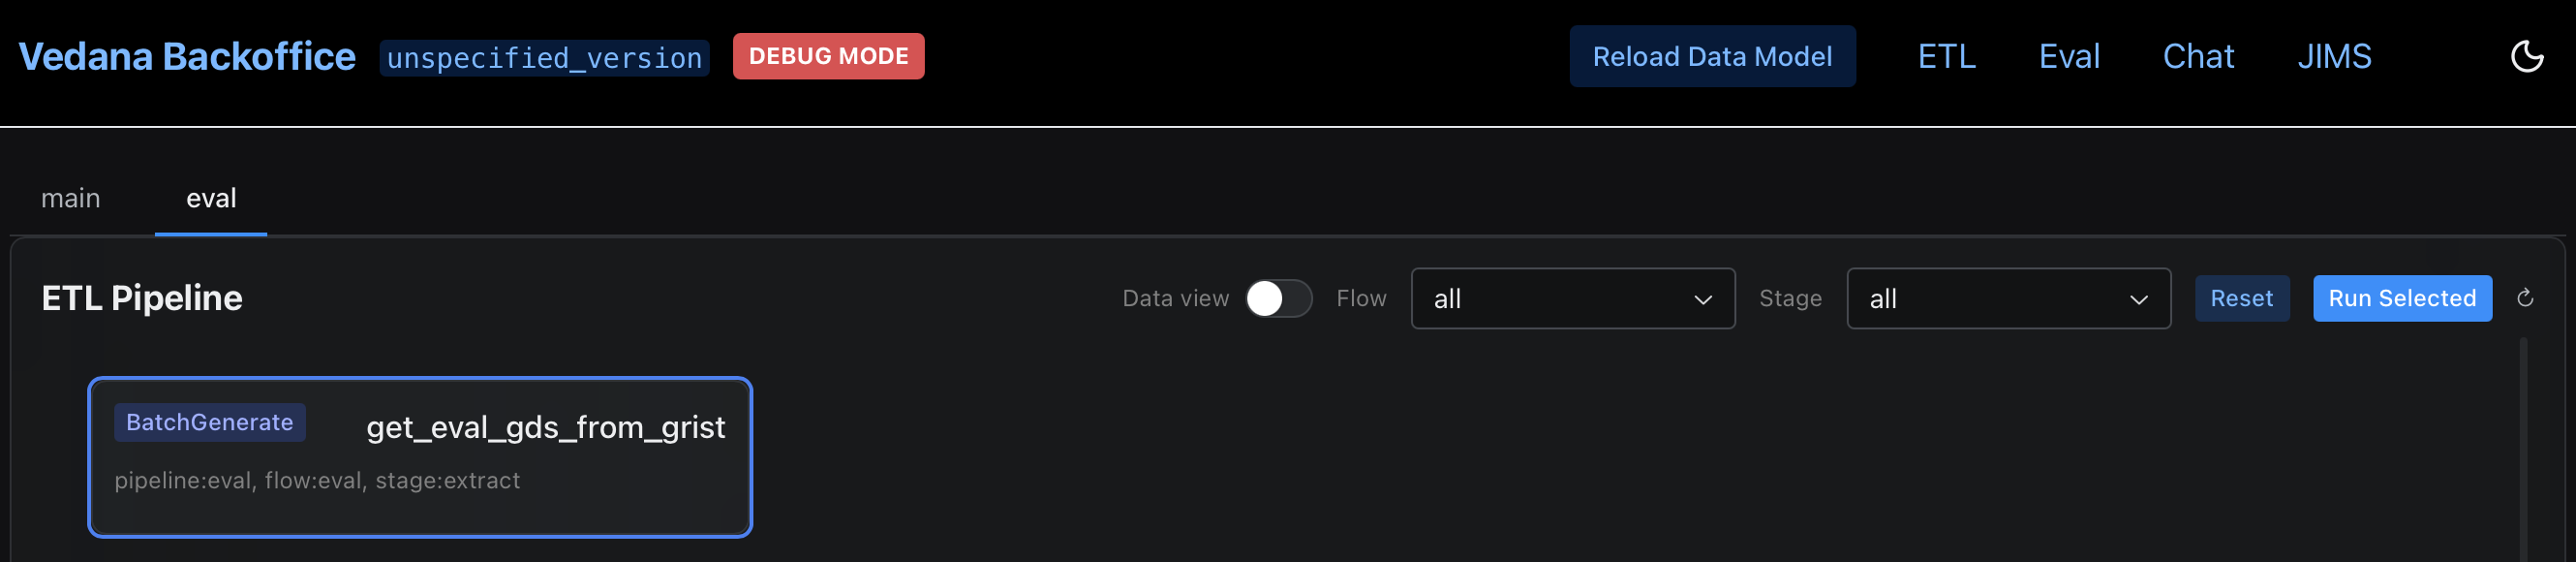
4. Trigger an evaluation run
Open the Backoffice at http://localhost:8000, navigate to the ETL section, and trigger a metrics run. Open eval tab in ETL section and start evaluation pipeline by clicking ‘Run Selected’. The pipeline will iterate over each question in the golden dataset, send it to the chat endpoint, and record the response alongside the expected answer.
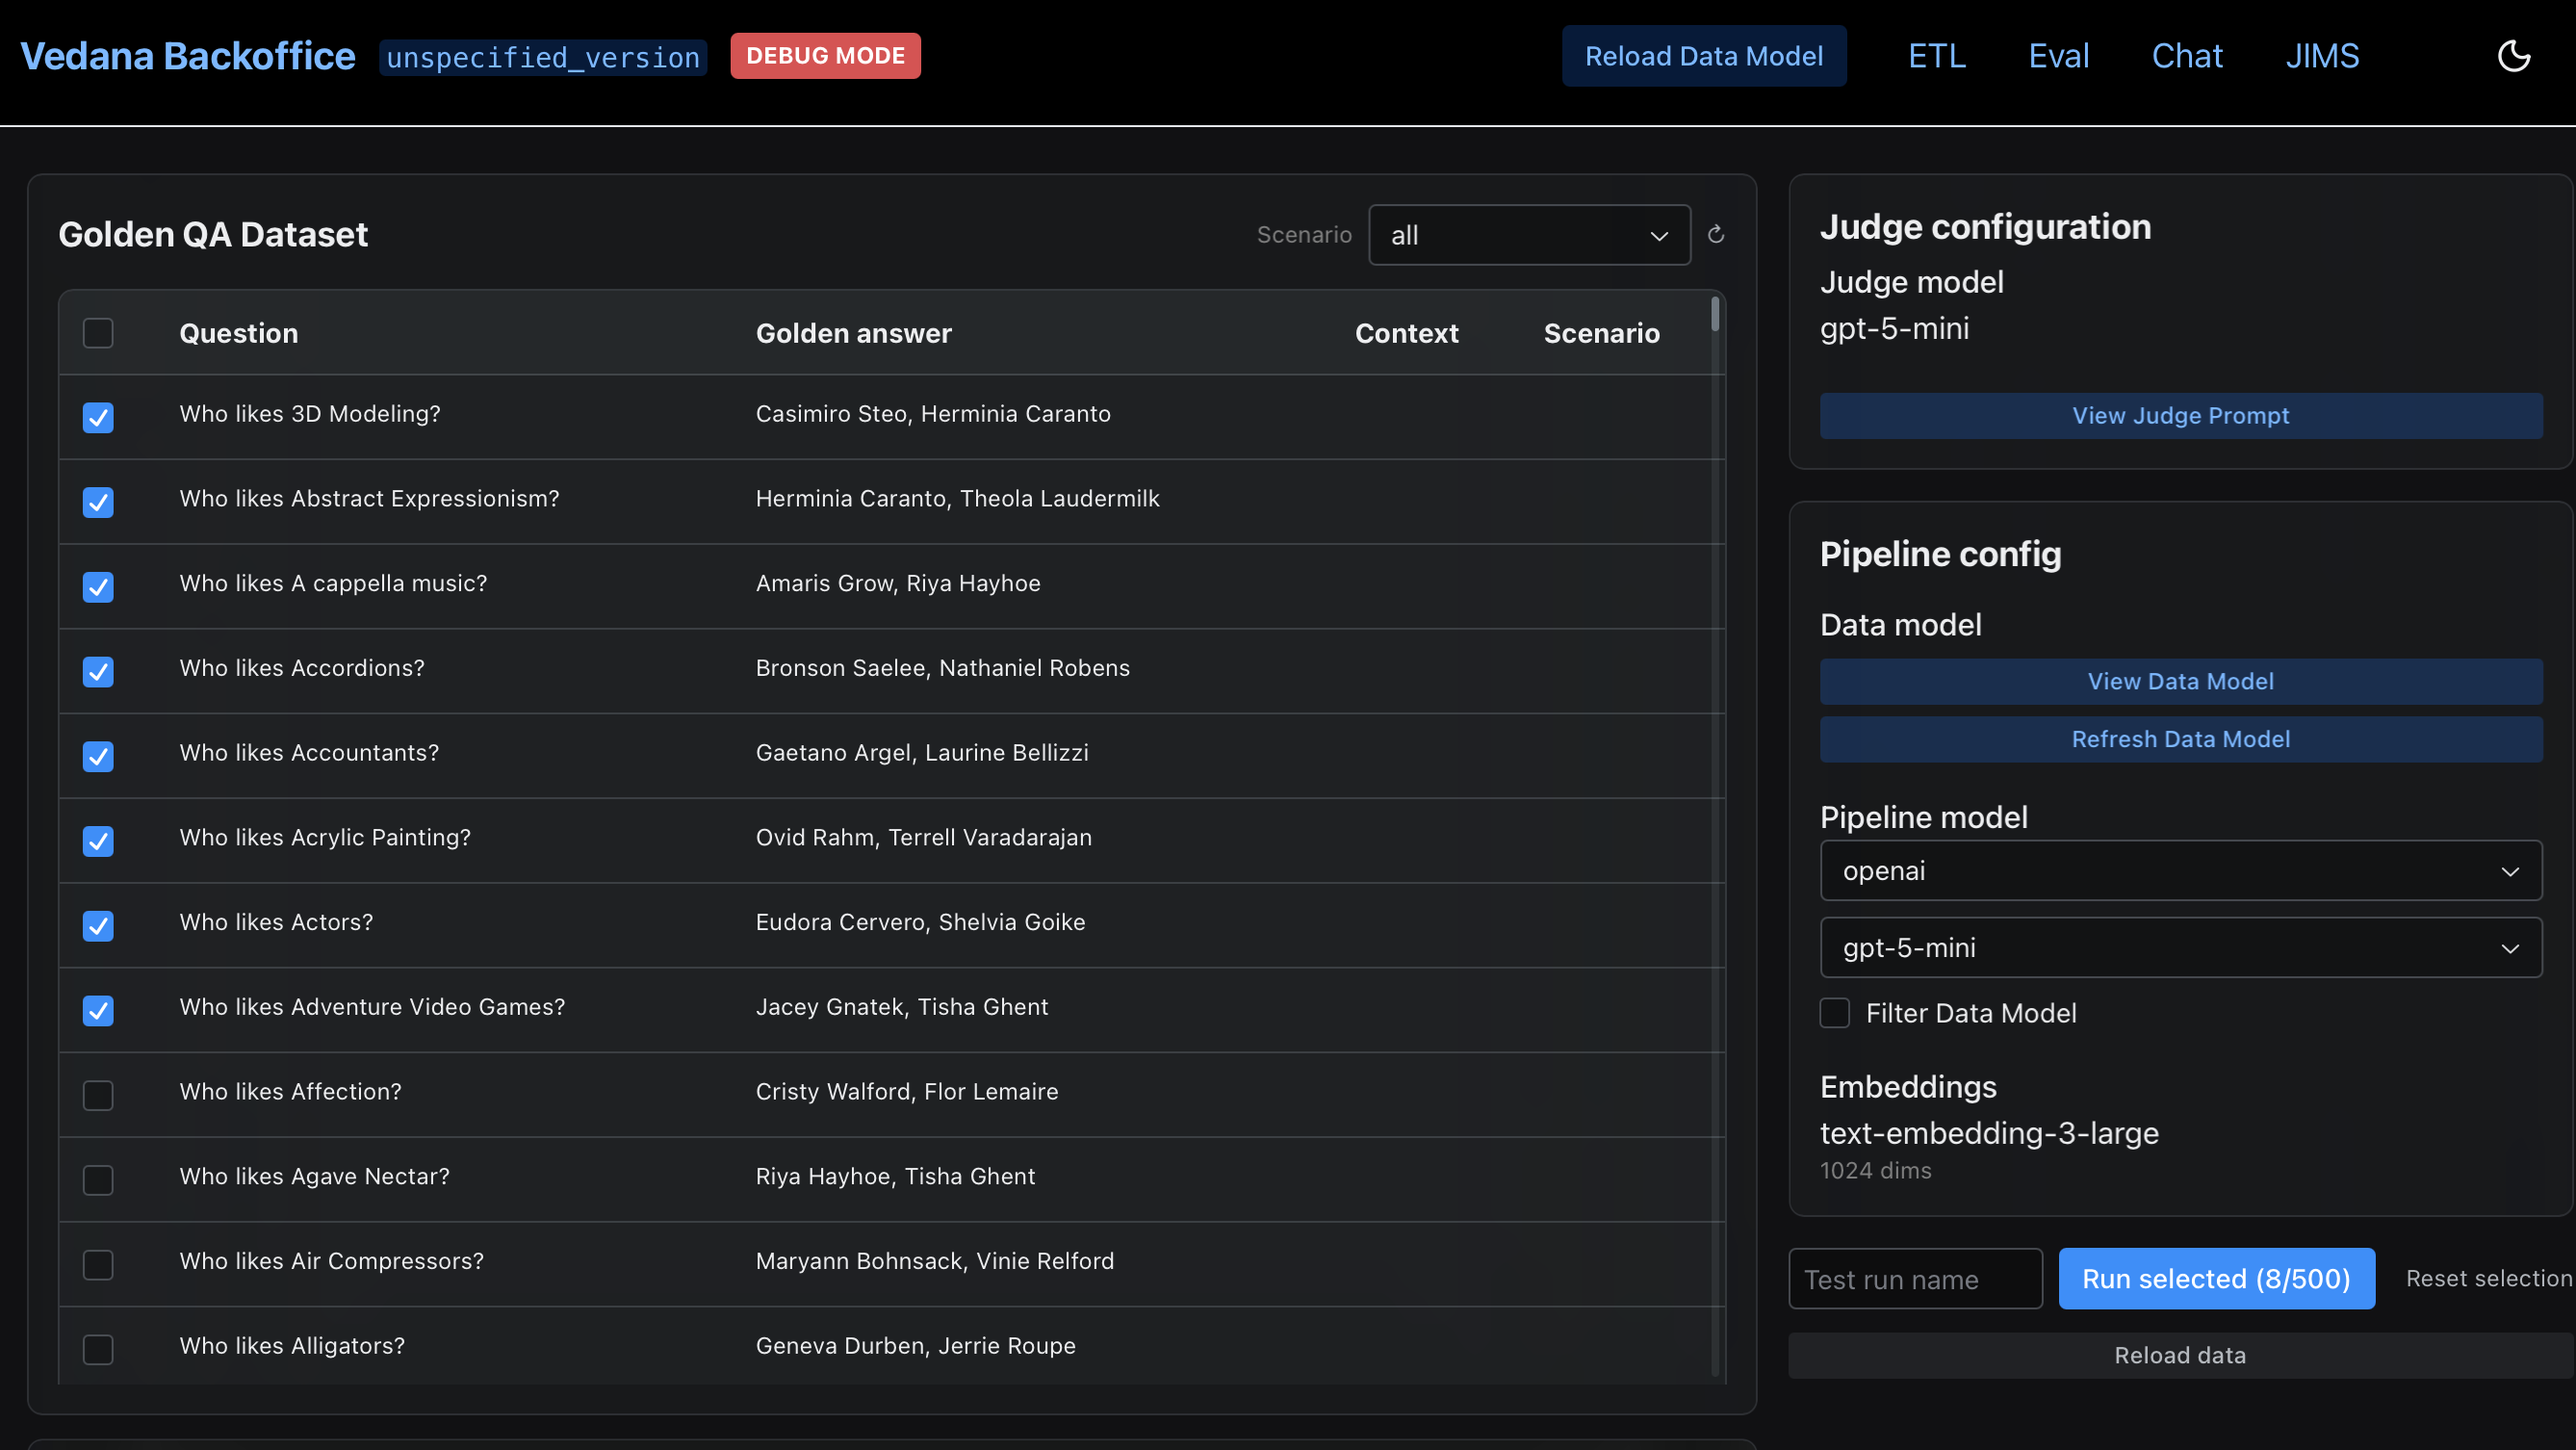
How to Evaluate Metrics
Once ETL is complete and the chat endpoint is responding, run the evaluation pipeline from the Backoffice. Navigate to the Evaluation (Eval) section and trigger a metrics run:
- In Golden QA Dataset window select questions.
- Check Judge Configuration and Pipeline Configuration.
- Refresh Data Model.
- Start metrics run by clicking ‘Run Selected’.
The pipeline will:
- Iterate over each question in the golden dataset
- Send it to the chat endpoint
- Compare the response against the expected answer
- Compute retrieval metrics
Hit Rate
The primary metric is Hit Rate — the proportion of questions for which the correct answer was retrieved. It is expressed as a value between 0 and 1, where 1.0 means every question returned the correct answer.
A hit rate above 0.8 is generally considered a good baseline for a well-modeled domain. Below 0.6 indicates systematic retrieval problems that need to be addressed before the system is production-ready.
Per-question breakdown
In addition to the aggregate score, the evaluation output includes a per-question breakdown showing which questions passed, which failed, and what the system returned. Use this to identify patterns in failures rather than treating hit rate as a single number to optimize.
Common failure patterns and what they indicate:
| Pattern | Likely cause |
|---|---|
| Structured questions failing (names, dates, values) | Anchor or attribute missing from data model, or ETL did not complete |
| Document questions failing | Poor chunking, missing embeddings, or wrong playbook tool selection |
| A whole category of questions failing | Playbook routing the wrong intent to the wrong tool |
| Inconsistent results across similar questions | Embed threshold too low or too high for semantic search fields |
Iterating on results
Evaluation is most useful as an iteration loop, not a one-time check. After identifying failure patterns:
- Adjust the data model, playbook, or chunking configuration in Grist
- Re-run ETL
- Re-run the evaluation
- Compare hit rate before and after
Each iteration should be targeted — change one thing at a time so the effect of each adjustment is measurable. Adding questions to the golden dataset over time, particularly questions derived from real user queries, will make the benchmark progressively more representative of production behavior.